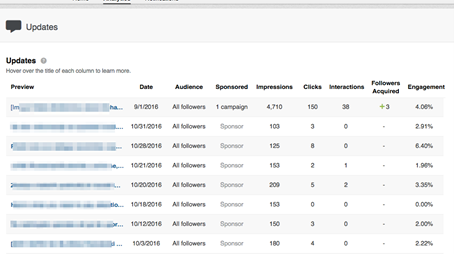
Under the analytics tab on your LinkedIn Company Page you see something like this:

Some categories are self-explanatory, and the ones you need to pay attention to when analyzing your updates are the following:
- Category “Impressions” tell you the number of times each update was shown to LinkedIn members.
- Category “Clicks” tells you the number of clicks on your content, company name, or logo. This doesn’t include interactions (shares, likes, and comments).
- Category “Interactions” tells you the number of times people have liked, commented on, and shared each update.
- Category “Followers Acquired” tells you how many followers you gained by promoting each update.
- Category “Engagement” shows the number of interactions plus the number of clicks and followers acquired, divided by the number of impressions.
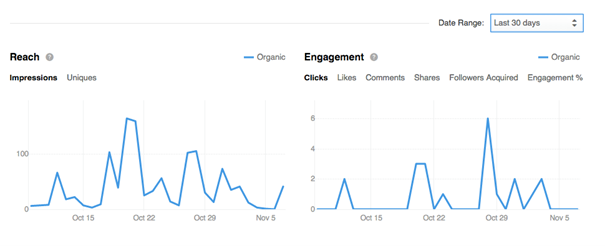
And the last two things you should pay attention to are two graphs that show you the reach and engagement of your updates. Reach tells you how many times your updates were seen, both organically and through paid campaigns, on a daily basis. Engagement, on the other hand, tells you how many times members clicked, liked, commented on, and shared your content in both organic and paid campaigns, as well as the number of followers acquired through paid campaigns. For both, you can adjust the date range with a dropdown menu.

Remember – creating your updates is just the first step. If the right audience doesn’t see them and if you don’t figure which work and which don’t, you can’t expect good results.
